


Timeline Debugger for the Qiskit Transpiler
Qiskit transpiler is an important tool used to map any arbitrary quantum circuit into a physically runnable one, compatible with the properties of its target quantum backend. This process, called transpilation, includes expanding a circuit to the backend’s qubit count, breaking down higher level quantum operations in terms of the supported basis set, and routing qubits according to the chip connectivity and optimization of the final circuit. While Qiskit’s transpiler has built-in logging and callback mechanisms to help users understand about transpilation, most users don’t know about these methods, nor have sufficient knowledge about using them. This is where the project comes with an aim to provide an insight into the qiskit transpiler.
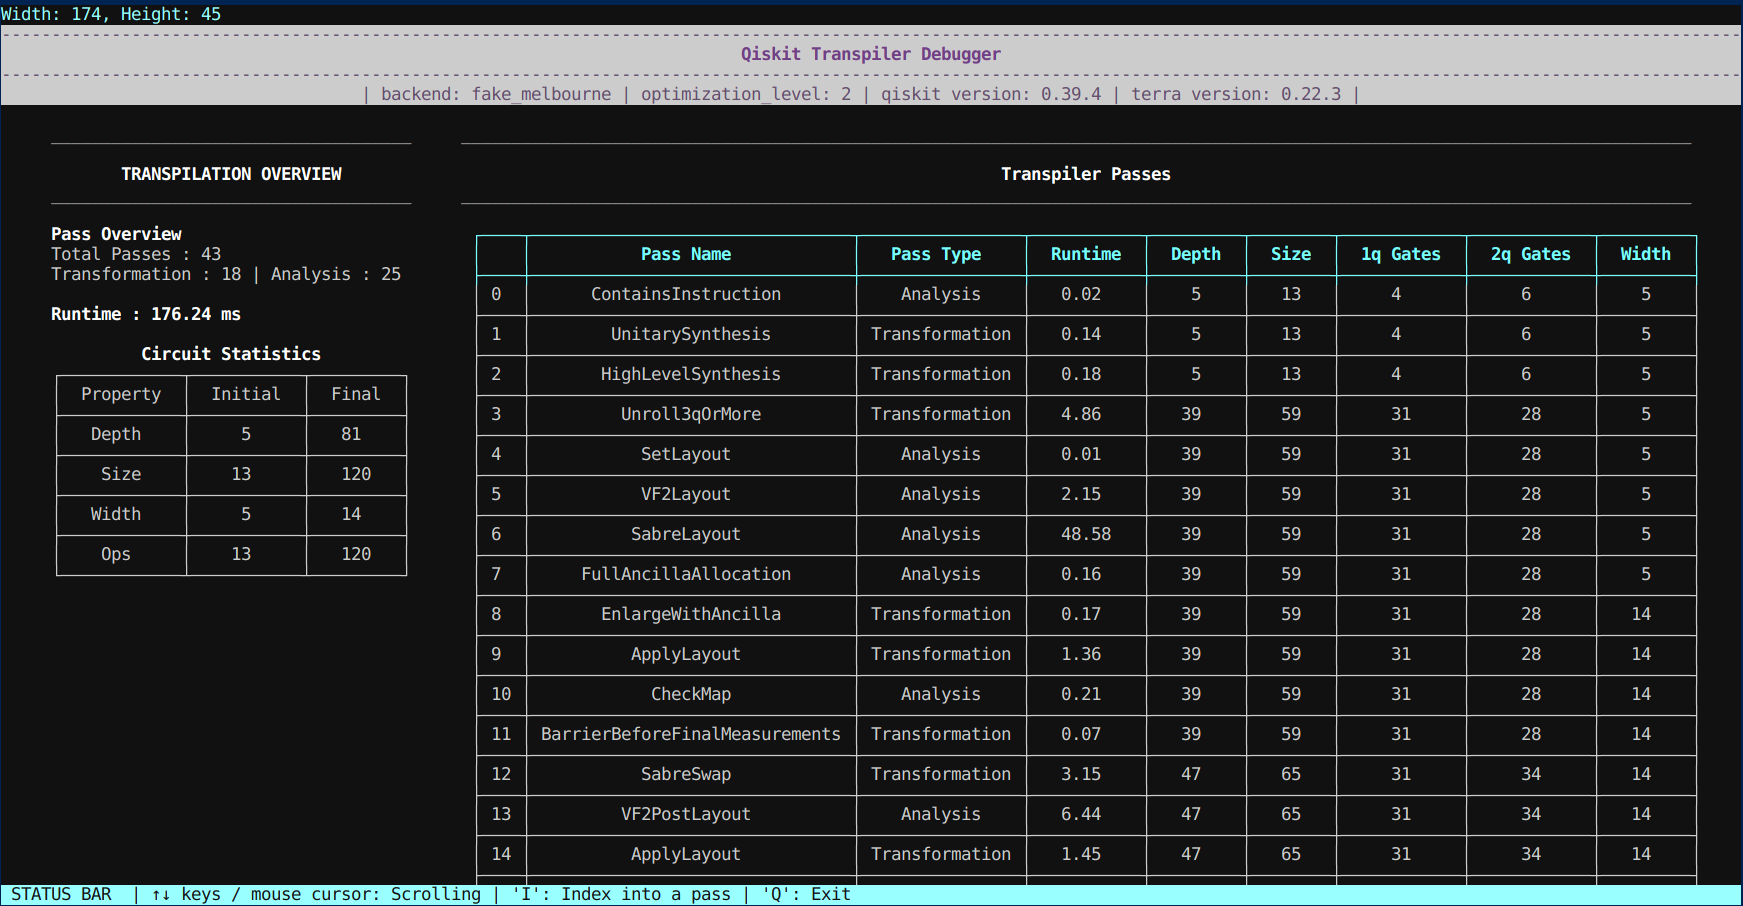
Qiskit Trebugger (transpiler-debugger) is a tool which provides a visual representation of the transpilation process. It was developed as an interactive tool with multiple views catering to the needs of different users. Available as a python package on PyPI, it can be used as a jupyter widget or a lightweight CLI tool to understand how a circuit goes through the qiskit transpiler. The following image shows a preview of the CLI view -
The debugger is divided into three main components -
1. Overview of the Transpilation Process There are two panels which highlight crucial information about the transpilation process. Some basic information such as the quantum backend, optimization level and version information is specified as the first level of information. The second level contains the total number of passes executed, and a comparison of the different statistics for the original and final circuits.
2. Details of the Transpilation Process The transpilation process in qiskit consists of multiple passes. Each of these passes either changes the circuit (Transformation) or the property set (Analysis). Moreover, the circuit properties such as its depth, width, operation count and type of gates change after each pass is executed. Both of the jupyter and CLI views provide a consolidated dashboard for this evolution.
3. Pass Level Details On a more granular level, users can also see a detailed view of each pass. This consists of the current circuit diagram, property set, logs emitted, documentation and the time of execution for the pass.
The pip install qiskit-trebugger command can be used to install the package in your python environment.
Views
- Jupyter
The debugger was originally built using the ipywidgets package for the jupyter notebook environment. Whenever our package is used to debug a quantum circuit, an interactive widget is rendered consisting of the transpilation overview and the transpiler pass information. Some special features supported by this view are circuit diffs and property set hierarchy. Using our circuit diff feature, users can see what exactly changed between the circuits of two transpiler passes whereas an expandable property set is provided for users to look at its internals.
Running the jupyter view
from qiskit.providers.fake_provider import FakeCasablanca
from qiskit.circuit.random import random_circuit
from qiskit_trebugger import Debugger
import warnings

warnings.simplefilter('ignore')
debugger = Debugger(view_type = "jupyter")
backend = FakeCasablanca()
circuit = random_circuit(num_qubits = 4, depth = 5 , seed = 44)

# replace qiskit's transpile call
debugger.debug(circuit, optimization_level = 2, backend = backend)
- CLI
The command line view for the debugger is a more recent development. Built using the ncurses and tabulate packages, it is a lightweight alternative to the jupyter view. It has minimal overhead for loading and can be used to debug circuits in a terminal environment. The CLI view is also interactive, with action keys for navigation and a status bar. Users can index into the pass list to see the details of each pass and toggle through different views. Most features of the jupyter view are supported in the CLI view as well. Note that this view can only be rendered in the terminal and not in a jupyter notebook.
Running the cli view
from qiskit.providers.fake_provider import FakeCasablanca
from qiskit.circuit.random import random_circuit
from qiskit_trebugger import Debugger
import warnings

warnings.simplefilter('ignore')
debugger = Debugger(view_type = "cli")
backend = FakeCasablanca()
circuit = random_circuit(num_qubits = 4, depth = 5 , seed = 44)

# replace qiskit's transpile call
debugger.debug(circuit, optimization_level = 2, backend = backend)
With that said, more information about the internals of the tool can be found in the following links -
The development of the project is under way with more upcoming features in both the CLI and the jupyter view. These include enhancing the logs and property set of the transpiler passes in the CLI view and introducing new elements in the widget such as the backend coupling maps, timeline drawer for qiskit pulse schedule and routing maps for the qubits.
A very big thanks goes out to Unitary Fund for supporting this project and giving us the opportunity to work on it. Moreover, we would also like to thank the Qiskit team for their support in the Qiskit Advocate Mentorship Program, and our mentors Kevin Krsulich and Matthew Treinish for their constant guidance and feedback.